Annual report is loading
Status and Trends Through 2015
Welcome!
The U.S. Environmental Protection Agency (EPA) is committed to protecting public health by improving air quality and reducing air pollution. This annual report presents the trends in the nation's air quality, and summarizes the detailed information found at EPA's AirTrends website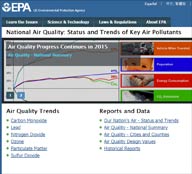 .
.
Please scroll down to view the annual report, use the top menu to jump to a topic or start by viewing the tutorial video . If encountering any issues viewing content, update or try opening the website in another browser.
Nationally, concentrations of the criteria air pollutants have dropped significantly since 1990:
During this same period the U.S. economy continued to grow, Americans drove more miles and population and energy use increased.
Tip Click pollutant names in the chart legend to hide or include trend lines, and hover over any line to display percentages above or below the most recent standard. Click the Emissions button below to open a popup window.
Air pollution consists of gas and particle contaminants that are present in the atmosphere. Gaseous pollutants include sulfur dioxide (SO2), oxides of nitrogen (NOx), ozone (O3), carbon monoxide (CO), volatile organic compounds (VOCs), certain toxic air pollutants and some gaseous forms of metals. Particle pollution (PM2.5 and PM10) includes a mixture of compounds that can be grouped into five major categories: sulfate, nitrate, elemental (black) carbon, organic carbon and crustal material.
Some pollutants are released directly into the atmosphere while other pollutants are formed in the air from chemical reactions. Ground-level ozone forms when emissions of NOx and VOCs react in the presence of sunlight. Air pollution impacts human health and the environment through a variety of pathways.
Generally, emissions of air pollution come from
As the chart shows, sources emit different combinations of pollutants. For example, electric utilities release SO2, NOx and particles.
Numerous scientific studies have linked air pollution to a variety of health problems.
People at greater risk for experiencing air pollution-related health effects may, depending on the pollutant, include those with heart and respiratory diseases and older adults and children (30-second Healthy Heart video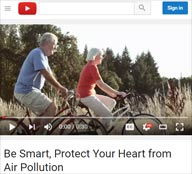 ).
).
By 2015, the combined emissions of the six common pollutants (PM2.5 and PM10, SO2, NOx, VOCs, CO and Pb) dropped 71 percent since 1970. This progress occurred while the U.S. economy continued to grow, Americans drove more miles and population and energy use increased.
2005 - 2014 NO2 satellite imagery courtesy of NASA
Charts Click and drag the green circle to manually change the year. Click on emission tabs to change the emissions chart.
Animation Click the play/pause button to start and pause animation. Click and drag the gray square in the slider to manually change the year.
Map Click on a monitor to display annual concentration data. Double click to zoom in. Click the home button to reset.
The different components that make up particle pollution come from specific sources and are often formed in the atmosphere. The major components, or species, are elemental carbon (EC), organic carbon (OC), sulfate and nitrate compounds, and crustal materials such as soil and ash.
As previously shown, PM2.5 concentrations are declining. Assessing particle pollution concentrations along with composition data aids in understanding the effectiveness of pollution controls and in quantifying the impacts to public health, regional visibility, ecology and climate.
Select a PM2.5 speciation trend and double click on any darker area to display county information. Lighter areas do not have speciation monitors, thus no data reported.
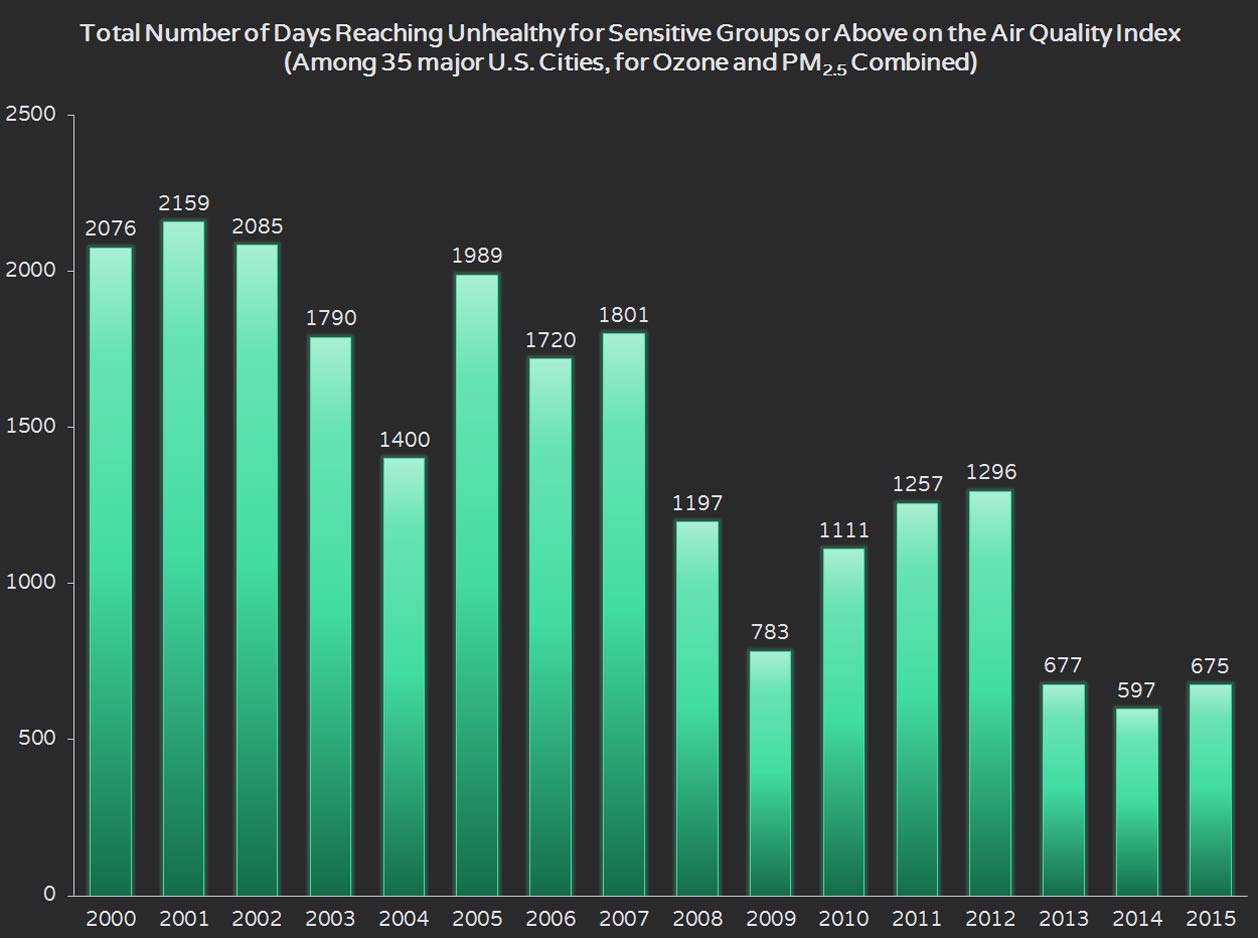
The Air Quality Index (AQI) relates daily air pollution concentrations for ozone, particle pollution, NO2, CO and SO2 to health concerns for sensitive groups and for the general public. A value of 100 corresponds to the national air quality standard for each pollutant. Values above 100 are considered unhealthy – first for certain sensitive groups of people, then for everyone as the AQI values increase. Fewer unhealthy air quality days means better health, longevity, and quality of life for all of us.
Shown are the number of days in which the combined ozone and PM2.5 AQI was above 100 for the years 2000-2015. Click on the bar chart, or these links, to view the AQI retrospective reviews: PM2.5 and ozone
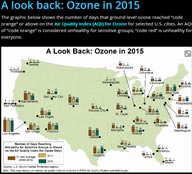 .
.
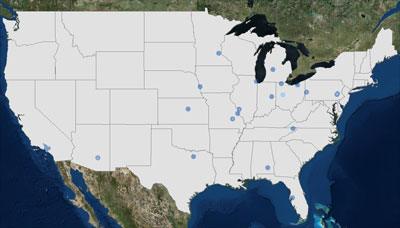
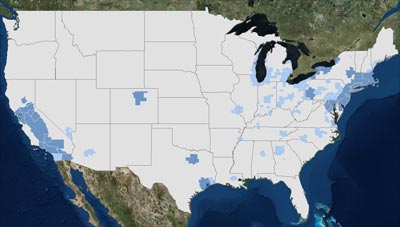
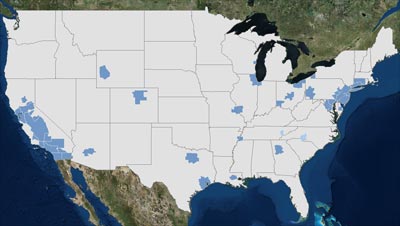
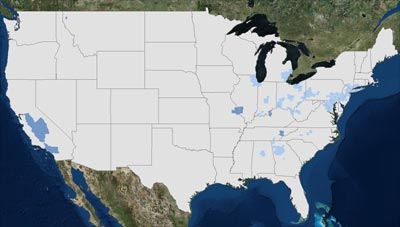
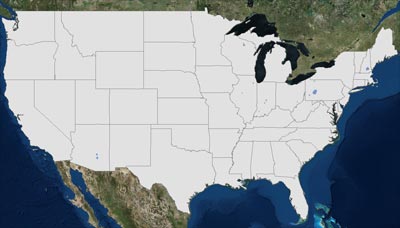
EPA works collaboratively with state, local and tribal agencies to identify areas of the U.S. that do not meet the national ambient air quality standards (NAAQS). These areas, known as nonattainment areas, must develop plans to reduce air pollution and attain the NAAQS.
Consistent with national averages, air quality in nonattainment areas has also improved. Since 2010, there were no violations of the standards for CO and NO2.
Shown are thumbnail images of the NAAQS nonattainment area maps. Click on any map to view a larger interactive version.
A large number of hot, dry days can lead to higher ozone levels in any given year, even if ozone-forming emissions remain unchanged. To better evaluate the progress and effectiveness of ozone precursor emission reduction programs, EPA uses a statistical model to estimate the influence of weather on ozone formation.
After accounting for the effects of weather, EPA's analysis confirms that ozone levels have continued to improve across the U.S. in recent years due to emission reduction programs. For more information please visit the AirTrends website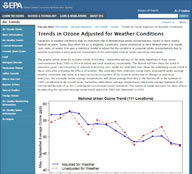 .
.
Yosemite National Park on a hazy day
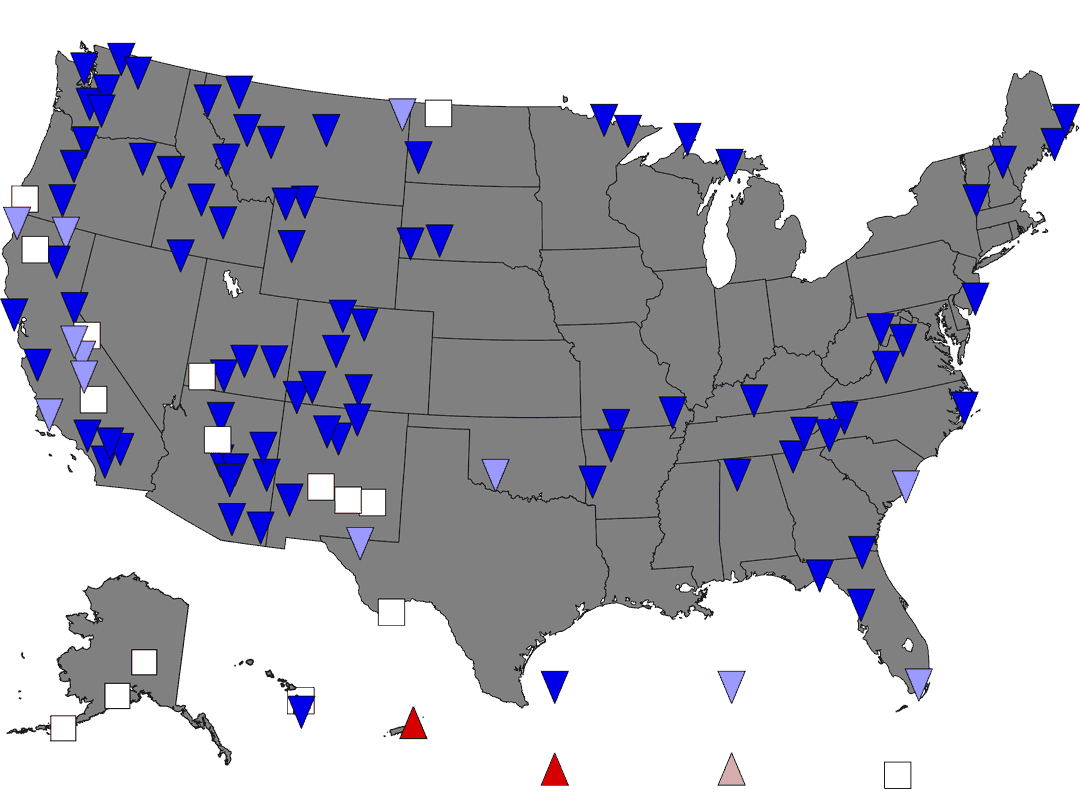
The National Park Service celebrates 100 years on August 25, 2016! Together, EPA and other agencies monitor visibility trends in 155 of the 156 national parks and wilderness areas (i.e., Class I areas), where clear views are an important value for visitors.
The map indicates a number of Class I areas have improving visibility or decreasing haze (indicated by the downward pointing arrows). To learn more about visibility in parks and view live webcams please visit this National Park Service website .
.
Ambient monitoring data show that some of the toxic air pollutants of greatest widespread concern to public health, such as benzene, 1,3-butadiene and several metals, are declining at most sites. The trend lines on the map are plotted on the same x (year) and y (mean concentration) axes and are directly comparable to each other. Sites may show high or low values in the short-term (spikes); however, colors indicate the long-term statistical trend direction: decreasing, increasing and no trend.
Use the dropdown menu to select a pollutant and hover on trend lines to view additional information. Click and drag over an area to zoom in. View a tabular summary of air toxics trends.
The NATTS trends table, included as a supplementary visual to the USA map, depicts air toxics mean concentration trends at the 27 national air toxics trends stations from 2003 to 2014. A vast majority of stations show decreasing or no trend in air toxics across the country.
of air toxics trends.
The NATTS trends table, included as a supplementary visual to the USA map, depicts air toxics mean concentration trends at the 27 national air toxics trends stations from 2003 to 2014. A vast majority of stations show decreasing or no trend in air toxics across the country.
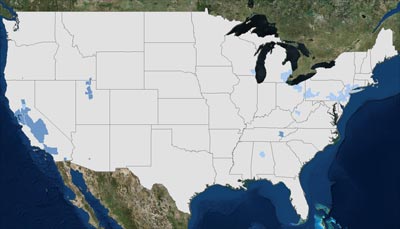
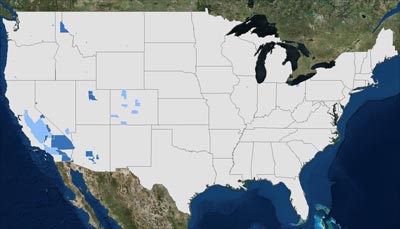
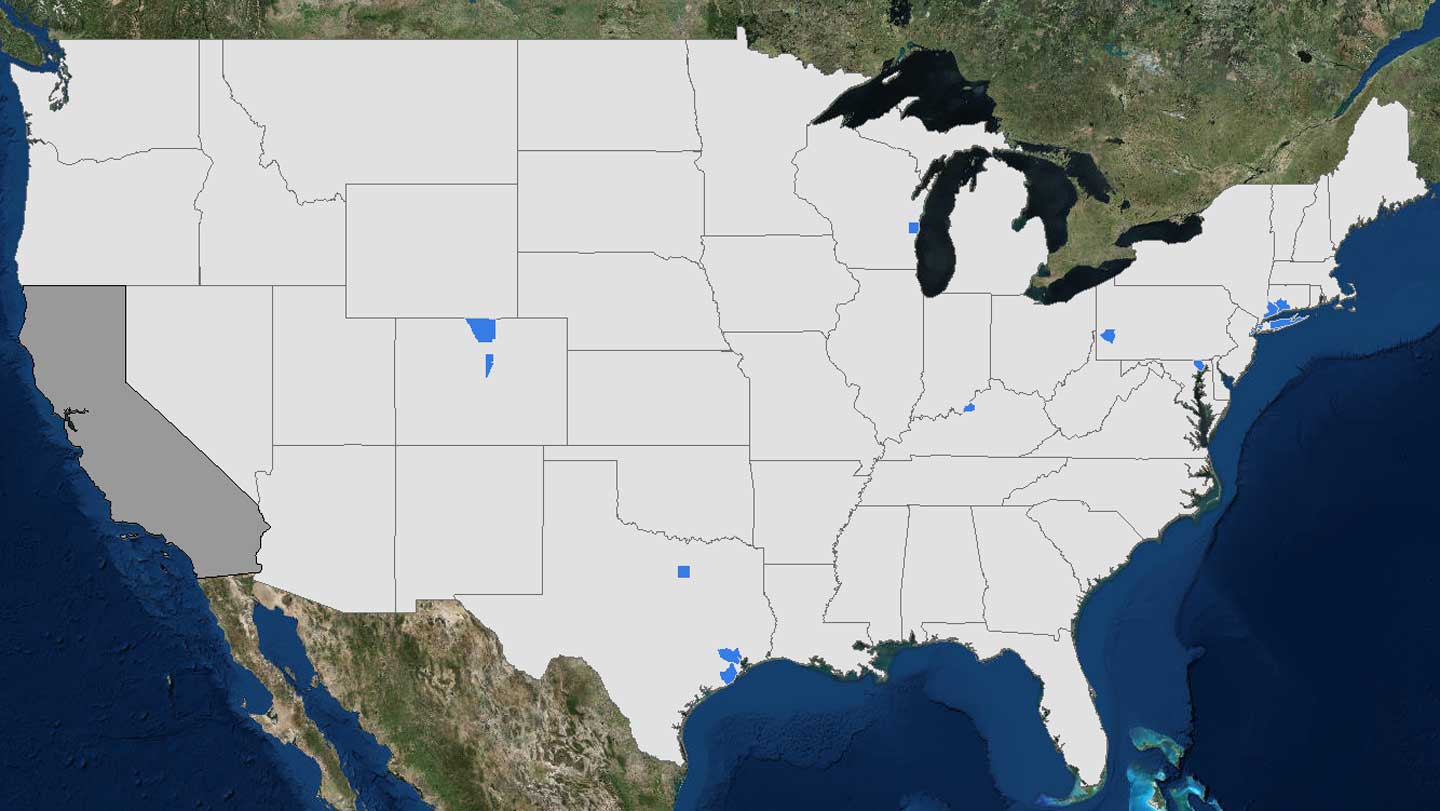
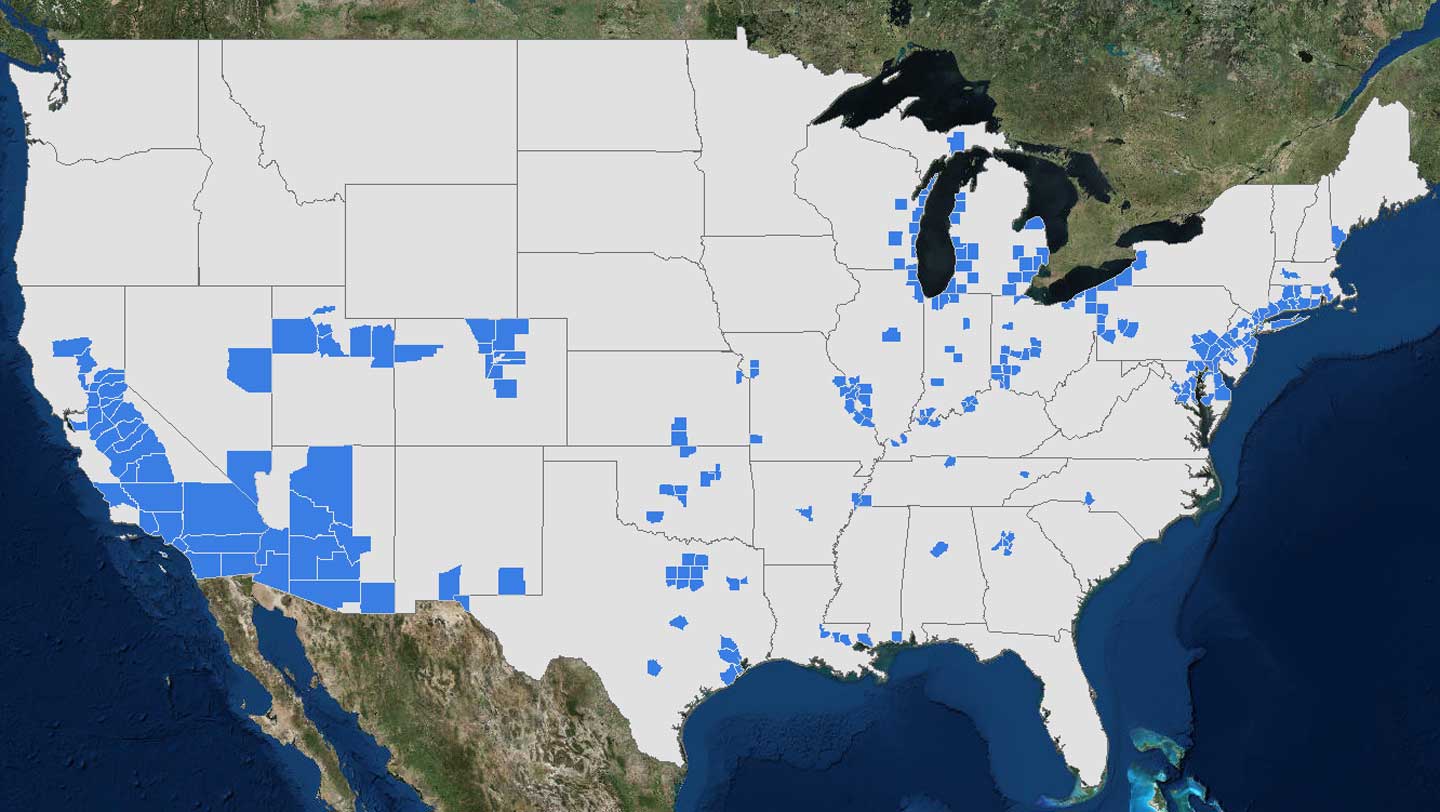
In 2015, EPA strengthened the national air quality standards for ground-level ozone to 70 parts per billion (ppb) averaged over 8 hours. Approximately 127 million people in 241 counties had monitors exceeding the revised ozone standard in 2015. However, in 2025 and beyond EPA projects these numbers will fall to 20 million people across 18 counties.
Federal rules, including the Cross-State Air Pollution Rule, Mercury and Air Toxics Standards, the Tier 3 Vehicle Emissions and Fuels Standards, and the Clean Power Plan, will help reduce ozone-forming pollution in the years ahead.
Toggle between the tabs at the top of the map to show 2015 versus projected 2025 information. Click either map to view a larger interactive version. View a PDF factsheet about efforts to reduce ozone in California.
Our Nation's Air continues to Improve.
However, work must continue to ensure healthy air for all communities. EPA and our partners at the state, tribal and local levels will continue to work to understand and address the increasingly complex air quality problems we face.
Additional Resources
Please visit other EPA air quality related websites.
Emissions of key air pollutants continue to decline from 1990 levels:
In addition, from 1990 to 2014 emissions of air toxics declined by 68 percent, largely driven by federal and state implementation of stationary and mobile source regulations.
*Wildfire data excluded for all pollutants except for NH3 pre-2002; PM emissions also exclude miscellaneous emissions (i.e., agricultural dust and prescribed fire data). Visit the emissions trends website to learn more.
EPA and states track direct emissions of air pollutants and emissions that contribute to the formation of key pollutants, also known as precursor emissions. Emissions data are compiled from many different organizations, including industry and state, tribal and local agencies. Some emissions data are based on actual measurements while others are estimates. For more information please visit the Air Emissions Inventories website .
.
EPA provides a daily AQI forecast so people can take action to protect their health. Shown is the current AQI forecast for PM and ozone combined. This map and others can be found at the AirNow website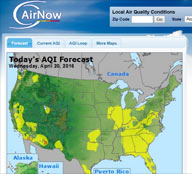 .
.
The Regional Haze Rule, published in 1999, requires states to identify the most effective means of preserving conditions in Class I areas when visibility is at its best (based on the 20% best or cleanest visibility days monitored) and to gradually improve visibility when it is most impaired (based on the 20% worst visibility days monitored).
Problems caused by regional air pollution can occur in many of our best known natural parks, such as the Grand Canyon, Yosemite, Yellowstone, Mount Rainier, Shenandoah, the Great Smokies, Acadia, and the Everglades as well as treasured wilderness areas such as the Okefenokee National Wildlife Refuge and Gila Wilderness areas. Efforts like the Regional Haze Rule have been significant in improving visibility in these special places.
Map of USA depicting either no trend or significant improving visibility trends at the majority of the 155 national parks and wilderness areas monitored on 20% haziest days.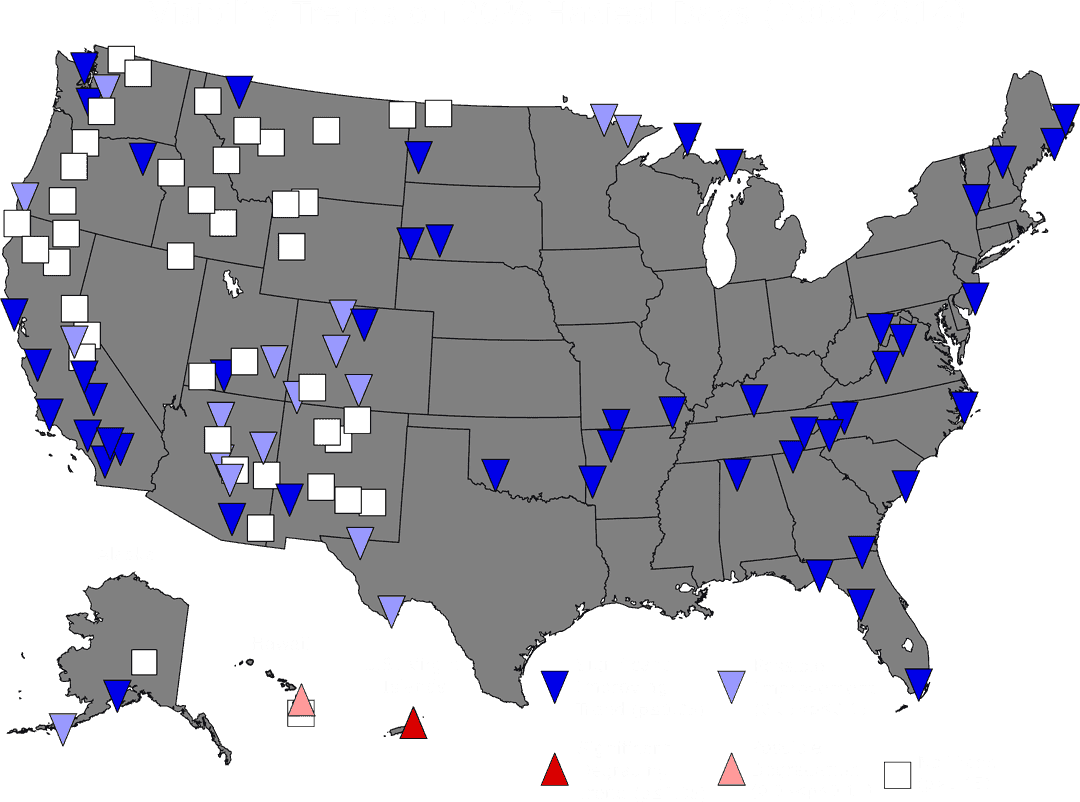
EPA frequently relies on modeling studies to supplement air toxic monitoring data. One such modeling study, the National Air Toxics Assessment (NATA), is a nationwide study of ambient levels, inhalation exposures, and health risks associated with toxic air pollutant emissions. While NATA cannot be used to directly define trends, it does put ambient levels in context to appropriate health endpoints. To learn more please visit the NATA website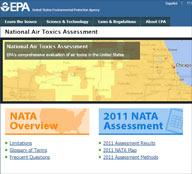 .
.