
OUR NATION'S AIR
Welcome!
The U.S. Environmental Protection Agency (EPA) is committed to protecting public health by improving air quality and reducing air pollution. This annual report, titled Our Nation's Air, summarizes the nation's air quality status and trends through 2018. Please read and enjoy the full report below, and be sure to download and share the one page summary using the share button at the top. Additional detail on air trends can be found at EPA's AirTrends website.
Scroll down to read more or use the top menu to jump to a topic. If you encounter any issues viewing content, update or try opening the website in another browser.

Intro
Since 1970, implementation of the Clean Air Act and technological advances from American Innovators have dramatically improved air quality in the U.S. Cleaner air provides important public health benefits.
Air Quality Trends Show Clean Air Progress
Nationally, concentrations of air pollutants have dropped significantly since 1990:
- Carbon Monoxide (CO) 8-Hour, 74%
- Lead (Pb) 3-Month Average, 82% (from 2010)
- Nitrogen Dioxide (NO2) Annual, 57%
- Nitrogen Dioxide (NO2) 1-Hour, 50%
- Ozone (O3) 8-Hour, 21%
- Particulate Matter 10 microns (PM10) 24-Hour, 26%
- Particulate Matter 2.5 microns (PM2.5) Annual, 39% (from 2000)
- Particulate Matter 2.5 microns (PM2.5) 24-Hour, 34% (from 2000)
- Sulfur Dioxide (SO2) 1-Hour, 89%
- Numerous air toxics have declined with percentages varying by pollutant
During this same period, the U.S. economy continued to grow, Americans drove more miles and population and energy use increased.
Air quality concentrations can vary year to year, influenced not only by pollution emissions but also by natural events, such as dust storms and wildfires, and variations in weather.
Tip Click pollutant names in the chart legend to hide or include trend lines, and hover over any line to display percentages above or below the most recent standard. Click the Emission Totals tab to view emission trends.
Air Pollution Includes Gases and Particles
Air pollution consists of gas and particle contaminants that are present in the atmosphere. Gaseous pollutants include sulfur dioxide (SO2), oxides of nitrogen (NOx), ozone (O3), carbon monoxide (CO), volatile organic compounds (VOCs), certain toxic air pollutants and some gaseous forms of metals. Particle pollution (PM2.5 and PM10) includes a mixture of compounds that can be grouped into five major categories: sulfate, nitrate, elemental (black) carbon, organic carbon and crustal material.
Some pollutants are released directly into the atmosphere while other pollutants are formed in the air from chemical reactions. Ground-level ozone forms when emissions of NOx and VOCs react in the presence of sunlight. Air pollution impacts human health and the environment through a variety of pathways.
Understanding Emission Sources Helps Control Air Pollution
Generally, emissions of air pollution come from
- stationary fuel combustion sources (such as electric utilities and industrial boilers),
- industrial and other processes (such as metal smelters, petroleum refineries, cement kilns and dry cleaners),
- highway vehicles, and
- non-road mobile sources (such as recreational and construction equipment, marine vessels, aircraft and locomotives).
As the chart shows, pollutants are emitted by a variety of sources. For example, electric utilities, part of the stationary fuel combustion category, release SO2, NOx and particles.
Air Pollution Can Affect Our Health and Environment in Many Ways
Numerous scientific studies have linked air pollution to a variety of health problems. People at greater risk for experiencing air pollution-related health effects may, depending on the pollutant, include older adults, children and those with heart and respiratory diseases — 30-second Healthy Heart video.
Health Effects Breathing elevated levels of CO reduces the amount of oxygen reaching the body’s organs and tissues. For those with heart disease, this can result in chest pain and other symptoms leading to hospital admissions and emergency department visits.
Environmental Effects Emissions of CO contribute to the formation of CO2 and ozone, greenhouse gases that warm the atmosphere.
Health Effects Air toxics may cause a broad range of health effects depending on the specific pollutant, the amount of exposure, and how people are exposed. People who inhale high levels of certain air toxics may experience eye, nose and throat irritation, and difficulty breathing. Long term exposure to certain air toxics can cause cancer and long-term damage to the immune, neurological, reproductive, and respiratory systems. Some air toxics contribute to ozone and particle pollution with associated health effects (see above).
Environmental Effects Some toxic air pollutants accumulate in the food chain after depositing to soils and surface waters. Wildlife and livestock may also be harmed with sufficient exposure. Some toxic air pollutants contribute to ozone and particle pollution with associated environmental and climate effects (see above).
Health Effects Depending on the level of exposure, lead may harm the developing nervous system of children, resulting in lower IQs, learning deficits and behavioral problems. Longer-term exposure to higher levels of lead may contribute to cardiovascular effects, such as high blood pressure and heart disease in adults.
Environmental Effects Elevated amounts of lead accumulated in soils and fresh water bodies can result in decreased growth and reproductive rates in plants and animals.
Health Effects Short-term exposures to NO2 can aggravate respiratory diseases, particularly asthma, leading to respiratory symptoms, hospital admissions and emergency department visits. Long-term exposures to NO2 may contribute to asthma development and potentially increase susceptibility to respiratory infections.
Environmental Effects Oxides of nitrogen react with volatile organic compounds to form ozone and react with ammonia and other compounds to form particle pollution resulting in associated public health and environmental effects. Deposition of nitrogen oxides contributes to the acidification and nutrient enrichment (eutrophication, nitrogen saturation) of soils and surface waters. These effects can change the diversity of ecosystems.
Deposition of sulfur oxides contributes to the acidification of soils and surface waters and mercury methylation in wetland areas. Sulfur oxides cause injury to vegetation and species loss in aquatic and terrestrial systems and contribute to particle formation with associated environmental effects. Sulfate particles contribute to the cooling of the atmosphere.
Health Effects Ozone exposure reduces lung function and causes respiratory symptoms, such as coughing and shortness of breath. Ozone exposure also aggravates asthma and lung diseases such as emphysema leading to increased medication use, hospital admissions, and emergency department visits. Exposure to ozone may also increase the risk of premature mortality from respiratory causes. Short-term exposure to ozone is also associated with increased total non-accidental mortality, which includes deaths from respiratory causes.
Environmental Effects Ozone damages vegetation by injuring leaves, reducing photosynthesis, impairing reproduction and growth and decreasing crop yields. Ozone damage to plants may alter ecosystem structure, reduce biodiversity and decrease plant uptake of CO2. Ozone is also a greenhouse gas that contributes to the warming of the atmosphere.
Health Effects Exposures to PM, particularly fine particles referred to as PM2.5, can cause harmful effects on the cardiovascular system including heart attacks and strokes. These effects can result in emergency department visits, hospitalizations and, in some cases, premature death. PM exposures are also linked to harmful respiratory effects, including asthma attacks.
Environmental Effects Fine particles (PM2.5) are the main cause of reduced visibility (haze) in parts of the U.S., including many national parks and wilderness areas. PM can also be carried over long distances by wind and settle on soils or surface waters. The effects of settling include: making lakes and streams acidic; changing the nutrient balance in coastal waters and large river basins; depleting the nutrients in soil; damaging sensitive forests and farm crops; and affecting the diversity of ecosystems. PM can stain and damage stone and other materials, including culturally important objects such as statues and monuments.
Health Effects Short-term exposures to SO2 are linked with respiratory effects including difficulty breathing and increased asthma symptoms. These effects are particularly problematic for asthmatics while breathing deeply such as when exercising or playing. Short-term exposures to SO2 have also been connected to increased emergency department visits and hospital admissions for respiratory illnesses, particularly for at-risk populations including children, older adults and those with asthma. SO2 contributes to particle formation with associated health effects.
Growth
For more than forty years, the Clean Air Act has been a key part of cutting pollution as the U.S. economy has grown.
Economic Growth with Cleaner Air
Between 1970 and 2018, the combined emissions of the six common pollutants (PM2.5 and PM10, SO2, NOx, VOCs, CO and Pb) dropped by 74 percent. This progress occurred while the U.S. economy continued to grow, Americans drove more miles and population and energy use increased.
To learn more about the EPA and environmental milestones to reduce pollution please visit the EPA history website.
Tip Click any of the legend items on the right side of the chart to hide or include trend lines. The y-axis may change based on the selections.
National Ambient Air Quality Standards (NAAQS)
The Clean Air Act has brought Americans cleaner air and a lower risk of adverse health effects.
Criteria Pollutant Trends Show Clean Air Progress
Charts Click emission tabs to change the emissions chart. The play/pause button controls animation, or manually change the year by dragging the yellow circle in the chart or the slider's gray square. Read about weather influences on ozone. Few lead sites met trend completeness criteria to calculate national stats prior to 2010, and emissions data are only available for National Emissions Inventory (NEI) years.
Map Symbols indicate values above or below the most recent standard. Click any point to display annual concentration data. Double click the map to zoom in and click the home button to reset. Please be patient with map exports.
Understanding PM2.5 Composition Helps Reduce Fine Particle Pollution
The different components that make up particle pollution come from specific sources and are often formed in the atmosphere. The major components, or species, are elemental carbon (EC), organic carbon (OC), sulfate and nitrate compounds, and crustal materials such as soil and ash.
As previously shown, PM2.5 concentrations are declining. Assessing particle pollution concentrations along with composition data aids in understanding the effectiveness of pollution controls and in quantifying the impacts to public health, regional visibility, ecology and climate.
Tip Click any point to display 2000-2017 annual and quarterly PM2.5 speciation trends, and select maximize to enlarge the chart. Double click the map to zoom in and click the home button to reset.
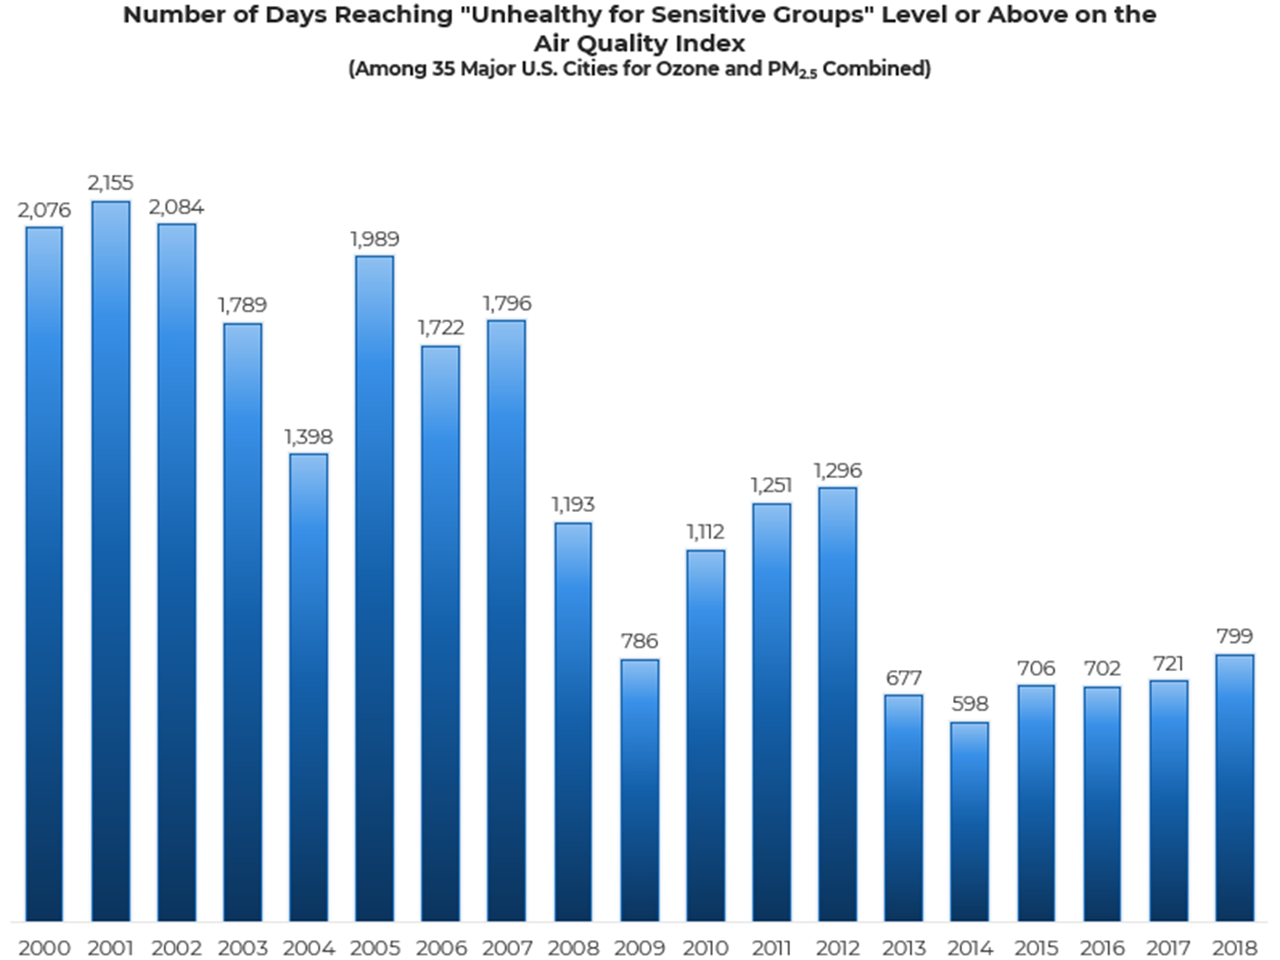
Unhealthy Air Days Show Long-Term Improvement
The Air Quality Index (AQI) is a color-coded index EPA uses to communicate daily air pollution for ozone, particle pollution, NO2, CO and SO2. A value in the unhealthy range, above the national air quality standard for any pollutant, is of concern first for sensitive groups, then for everyone as the AQI value increases. Fewer unhealthy air quality days means better health, longevity, and quality of life for all of us.
Tip Shown are the number of days in which the combined ozone and PM2.5 AQI was unhealthy for sensitive groups (orange) or above (red, purple or maroon) for the years 2000-2018. Click the bar chart, or these links, to view AQI retrospective reviews: PM2.5 or ozone.
Unhealthy air quality days vary year to year, influenced not only by pollution emissions but also by natural events, such as dust storms and wildfires, and variations in weather.
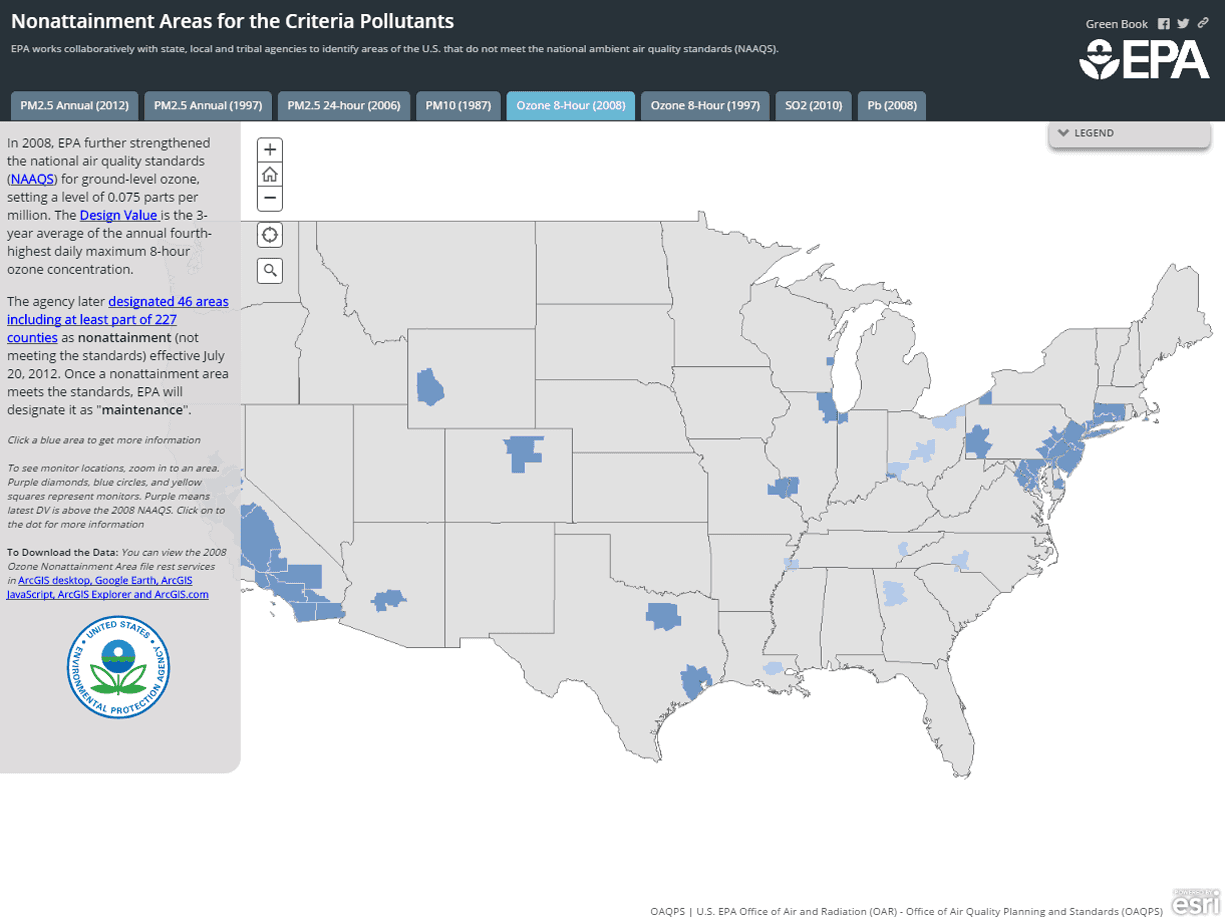
Air Quality in Nonattainment Areas Improves
EPA works collaboratively with state, local and tribal agencies to identify areas of the U.S. that do not meet the national ambient air quality standards (NAAQS). These areas, known as nonattainment areas, must develop plans to reduce air pollution and attain the NAAQS.
Through successful state led implementation, numerous areas across the country are showing improvement and fewer areas are in nonattainment. Since 2010, there were no violations of the standards for CO and NO2.
Tip Shown is a snapshot of the 2008 ozone nonattainment area map. Click the map to view a larger interactive version that includes all current NAAQS nonattainment areas.
Visibility
EPA has made significant progress in improving visibility in our nation's parks and wilderness areas.
Visibility Improves in Scenic Areas
EPA and other agencies, such as the National Park Service, monitor visibility trends in 155 of the 156 national parks and wilderness areas (i.e., Class I areas).
The map indicates several Class I areas have improving visibility or decreasing haze (indicated by the downward pointing arrows). To learn more about visibility in parks and view live webcams please visit this National Park Service website.
Tip Click any point to display 2000-2017 trends, and select maximize to enlarge the chart. Double click the map to zoom in and click the home button to reset.
Air Toxics
EPA works with state, local and tribal governments to reduce emissions of the 187 hazardous air pollutants.
Air Toxics Levels Trending Down
Ambient monitoring data show that some of the toxic air pollutants, such as benzene, 1,3-butadiene and several metals, are declining at most sites.
Points on the map indicate the long-term statistical trend direction: decreasing, increasing and no trend. Depicted in gray are sites where a trend direction is undetermined due to insufficient data.
Tip Use the dropdown menu to select a pollutant, click any point to display trends, and select maximize to enlarge the chart. Double click the map to zoom in and click the home button to reset. View a tabular summary of air toxics trends.
The NATTS trends table, included as a supplementary visual to the USA map, depicts air toxics mean concentration trends at the 27 national air toxics trends stations from 2003 to 2016. A majority of stations show decreasing or no trend in air toxics across the country.Based on the 2014 NATA, secondary pollution formation is the largest contributor to cancer risks nationwide, accounting for 47 percent of the risk. On-road mobile sources contribute the most risk from directly emitted pollutants (about 12 percent). Note: The air toxics monitoring data is available through 2016. This section has not been updated since last year’s report.
Spotlight
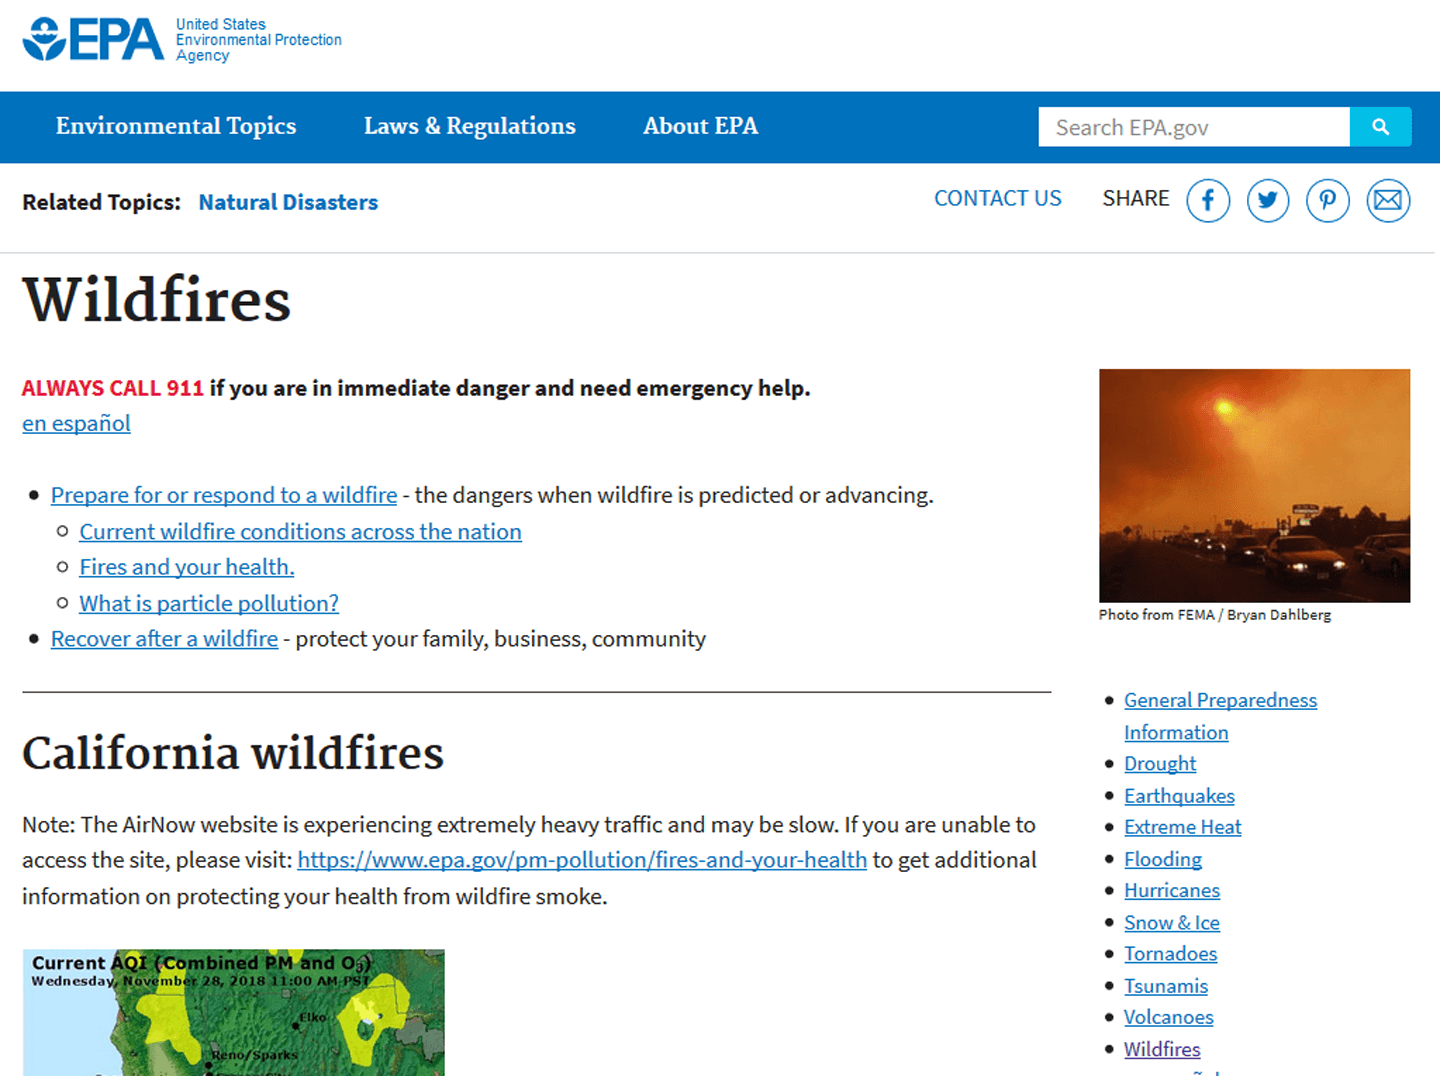
Fine particles in smoke can cause health problems such as burning eyes, runny nose, and illnesses such as bronchitis. These microscopic particles can also aggravate chronic heart and lung diseases.
Wildfires
Wildfire smoke can travel hundreds, even thousands, of miles from a fire causing significant air pollution events. Fine particles in smoke can pose a health threat particularly for children, older adults and people with heart or lung disease. Though healthy individuals are not usually at major risk from short-term exposures, it's important for everyone's health to reduce exposure where possible.
Wildfire events can lead to increases in particle pollution, and when in areas with a high number of air quality monitors can affect national concentration averages as seen in recent years. EPA's wildfire and smoke-ready toolbox websites provide resources to prepare and respond to wildfire events, check current air quality (AirNow ), and a link to download EPA's Smoke Sense app for your mobile device.
Our Nation's Air Continues to Improve
However, work must continue to ensure healthy air for all communities. EPA and our partners at the state, tribal and local levels will continue to work to address the complex air quality problems we face.
Download and share the one page summary and scroll down for additional resources.
Social Media
Use the share button at the top to share this report with others, and follow the latest EPA activities to protect human health and the environment using the buttons below.
Source code, data and documentation are available for download in the GitHub repository.
Additional Resources
Please visit other EPA air quality related websites.